The challenge
Leaders of a utility in the southern US suspected that a recent spike in system outages correlated with a perceived increase in severe weather events and challenged the analytics team to investigate. The team wanted to study historical weather trends to determine when and where weather may be impacting the utility’s system reliability.
The data was readily available, but the team lacked the expertise to gather meaningful insights from it. The team also knew it lacked the skills to properly layer the data and create a visual representation. The utility needed a nuanced set of model rules and advanced business intelligence capabilities.
The solution
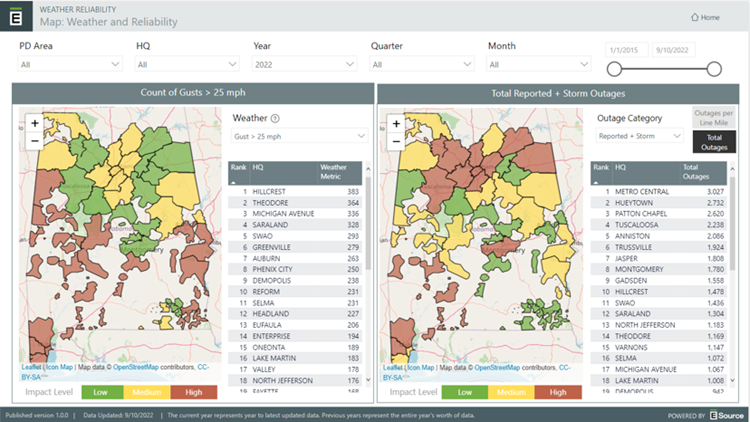
The utility turned to E Source to source and analyze historical weather data. E Source built a simple executive dashboard for the utility, overlaying weather data with spatial, temporal, and outage data. The dashboard enables the utility to identify key weather characteristics that cause distribution system outages and investigate specific operating locations.
The results
The E Source weather dashboard gave the utility the powerful resource it needed to address leadership’s concerns about severe weather trends and their effect on system reliability. The intuitive dashboard will also allow the utility to undertake thorough investigations with regional general managers to understand weather-related outages and reliability changes over time.
Future projects with E Source could include the creation of a model that can define a unified weather risk index to simplify analysis and derive meaningful and actionable insights. The utility could also invest in an E Source outage prediction model based on near-term weather forecasts.

