Big Behavior Savings Drive Big Behavior Spending
Have you ever received a home energy report? You know, one of those slips of paper stuffed in with your utility bill that shows you in primary colors how your energy use compares to that of your neighbors? With a smiley face or a little encouragement to save more, these seemingly small reports are making a big difference on customer energy bills and helping utilities reach increasingly aggressive energy-savings goals.
Humans don’t like to admit it, but we’re extremely sensitive to what our peers are doing. This tendency to mimic our friends makes sense in a historical context. If your hunter-gatherer neighbor ate a newly discovered plant and spent the rest of the day leaning against a tree, you could learn from that pain and avoid it. Today, we see this with technology adoption—minivans spreading through mom groups or the latest noise-cancelling headphones spreading through an office environment. Research has even shown that you can track the uptake of solar adoption by zip code—as more is installed and visible, more people buy in.
Utilities have tapped into this social awareness to inspire customers to save energy. By making our invisible energy use something we can see and compare, we can start making changes in our homes to “keep up with the Joneses.”
What kind of savings are utilities seeing from behavior programs?
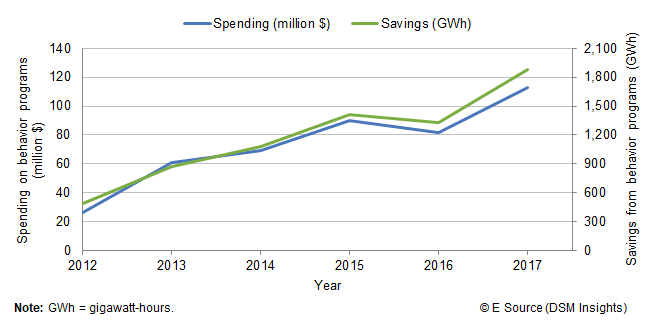
E Source has been tracking utility behavior programs, which mostly consist of home energy report programs, since their inception in utility demand-side management (DSM) portfolios a decade ago. Using data from DSM Insights—which extracts and compiles data from utility filings with public utility commissions, DSM annual reports, program evaluation studies, and other industry sources—we reviewed information on more than 7,000 DSM programs run by 259 program administrators in the US and Canada. We found that utility spending on residential behavior programs increased by more than 430% since 2012, while energy savings from these programs grew more than 380% (figure 1).
Figure 1: Utility spending and savings on residential behavior programs
Those savings make up a bigger percentage of total DSM portfolios than ever before—reaching more than 12% of average portfolio savings in 2017. This means behavior programs are a key component of a postlighting DSM portfolio strategy.
Want to learn more about behavior programs?
To learn more about E Source’s behavior research, check out a Behavior, Energy, and Climate Change (BECC) webinar Utilities Investing in Behavior Change Programs: Get the Inside Scoop!, where I shared some leading and unique behavior program models. Our full research on behavior program spending and savings is available to members of the E Source Demand-Side Management Service in the report Behavioral programs continue to deliver energy savings.
What’s your take on utility behavior programs? We’d love to hear about your challenges and successes in the comments below.