Utilities invest hundreds of millions of dollars every year into their demand-side management (DSM) programs. How can utility industry vendors like program implementers, consultants, software providers, and equipment manufacturers find and win opportunities to capture some of this spending? And how can they find details about the programs they could be a part of? E Source has a suite of data tools that can help you identify and research new business opportunities.
Most utilities are required to file publicly available plans, annual reports, and evaluations for their DSM portfolios. But these resources can be hard to find. And they’re certainly hard to turn into usable information as you sort through program performance, spending, and planning cycles across portfolios. This is because of several reasons:
- The documents are lengthy and complex
- Publication dates can be unpredictable
- Aggregating information across utilities is time consuming
- Regulatory websites and filing dockets are exceedingly cumbersome to navigate
Some solution providers that help utilities with energy efficiency, demand response (DR), transportation electrification, and distributed energy resource (DER) management have staff who track program performance and find market opportunities. Our data tools can do all of that work for you.
Here’s how our portfolio of DSM tools can help.
Get a view of the DSM landscape with just a click
Instead of digging through filings or reaching out to individual utilities to discuss program goals and outcomes, use our tools to quickly get a full view of DSM portfolios. This will give you more time to spend presenting your solutions to utilities.
E Source DSM Insights
DSM Insights lets you benchmark DSM program and portfolio spending and performance. This powerful tool eliminates the hassle of navigating state-level filing systems one at a time. In our single platform, we give you access to important data points including budget, spending, and program performance information across energy efficiency, DR, and other DER programs that are included in DSM portfolios. This lets you compare portfolio- and program-level information on issues like spending, electric and gas savings, cost-effectiveness, participation, and plan versus actual performance.
E Source DSM Evaluation Library
DSM Evaluation Library consolidates program evaluations written by utilities and third parties. The interface lets you filter by geography, date, administrator, implementer, location, year, resource, sector, and evaluation type. You can download PDFs of the evaluations directly from the tool.
E Source DSMdat
DSMdat is a searchable database of DSM programs throughout the US and Canada. It identifies:
- Which programs utilities are running
- How portfolios are structured
- What rebates are offered (organized by technology and program type)
- Which measures and associated technologies are included in each program
Identify new business-development opportunities with DSM Insights
Here are a few examples of how you can use the tools to find new opportunities.
Get ahead of RFPs using the “Regulatory Filings Schedules” dashboard
The DSM Insights “Regulatory Filings Schedules” dashboard shows you when new plan filings are expected, how long utilities’ planning cycles are, and how much spending might be involved (figure 1). You can use this information to target utilities that are expected to release plans in the next few years and will likely be looking for proposals from solution providers.
Figure 1: The DSM Insights “Regulatory Filings Schedules” dashboard
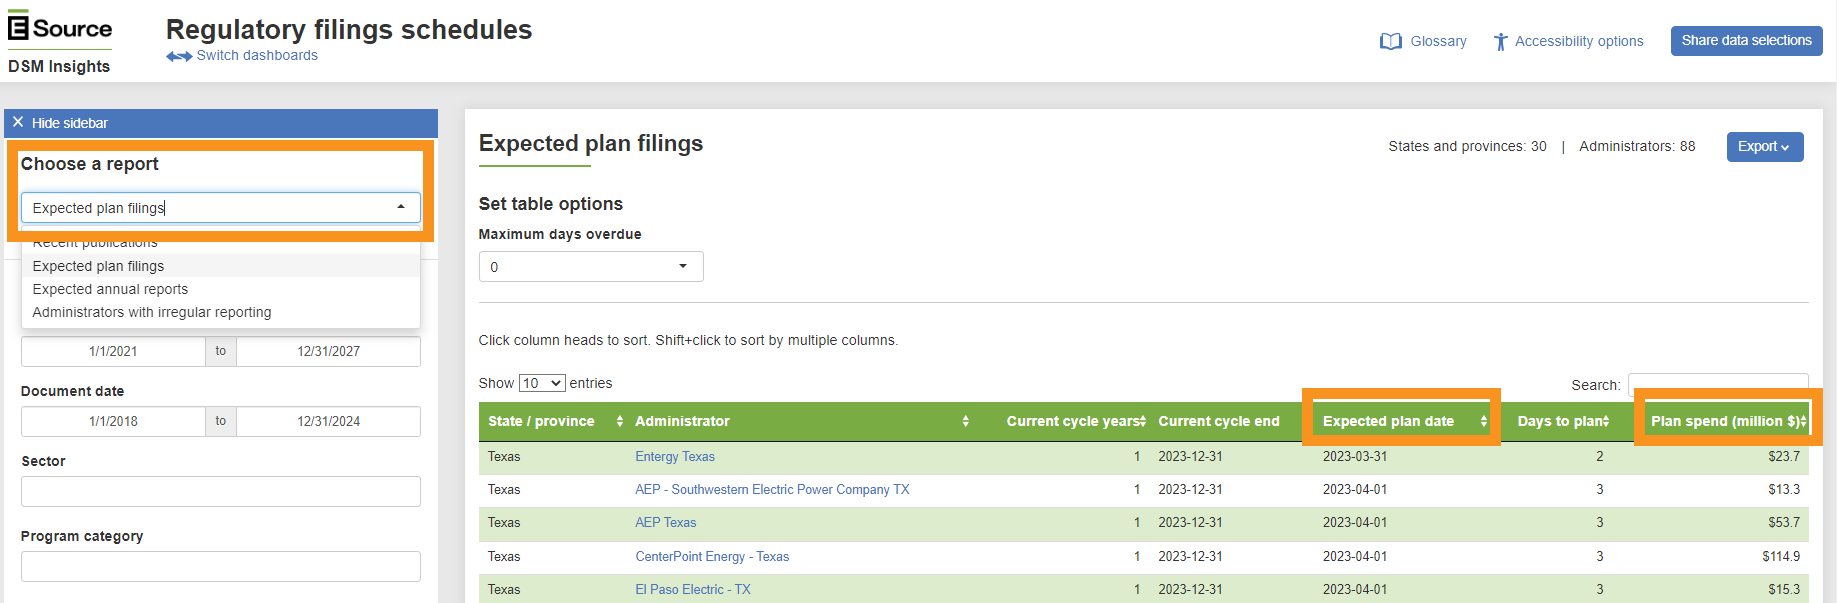
The table in the dashboard shows you the cycle length, cycle end date, expected plan date, and projected total plan spending. These details can help you focus, for example, on utilities that are expected to release plans within the next two years or utilities with the biggest spending.
With this information, you can then use the other DSM Insights dashboards to see how a utility’s portfolio has been performing, understand how it’s structured, and see where there are opportunities for your company to help the utility improve.
Help utilities succeed with our “Program Benchmarking” dashboard
The “Program Benchmarking” dashboard is a powerful tool to help you understand program performance, budget allocations, and ways your company can fill gaps and improve program performance. For example, if you identified a potential utility partner through the “Regulatory Filing Schedules” dashboard, you could use the “Program Benchmarking” dashboard’s goal achievement report to identify under- or overperforming programs (figure 2).
Figure 2: The DSM Insights “Program Benchmarking” dashboard
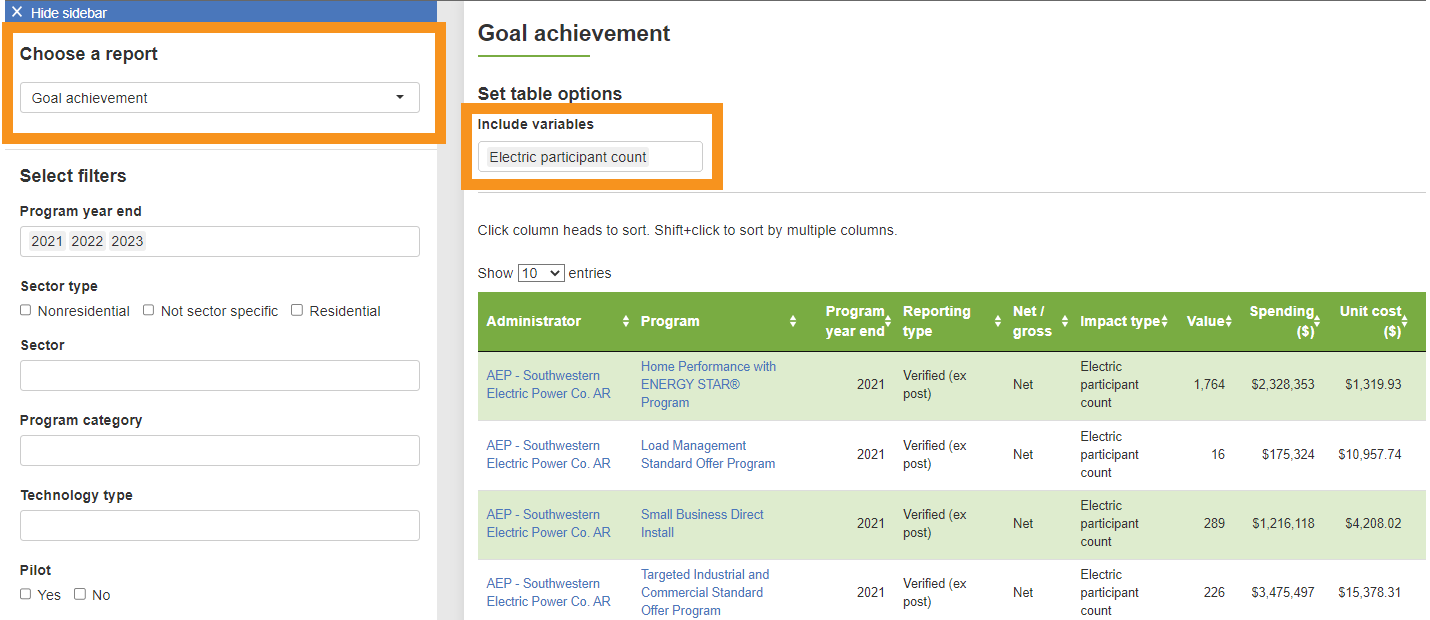
Here, at the program level, you can see how a given utility’s programs performed. How cost-effective was the program? What percentage of planned savings or participation did the program achieve? What percentage of the budget did the program spend? These metrics can clearly show you:
- Which programs a utility might want help improving
- Which programs are good examples you can learn from
- Where there are gaps in the portfolio in terms of program type or technology
- Which program areas a utility performing better or worse in
See incumbent solution providers with the View providers option
In the “Program Benchmarking” dashboard, the “View Providers” checkbox shows you who’s implementing which programs and which companies utilities have worked with in the past (figure 3).
Figure 3: The DSM Insights program list report
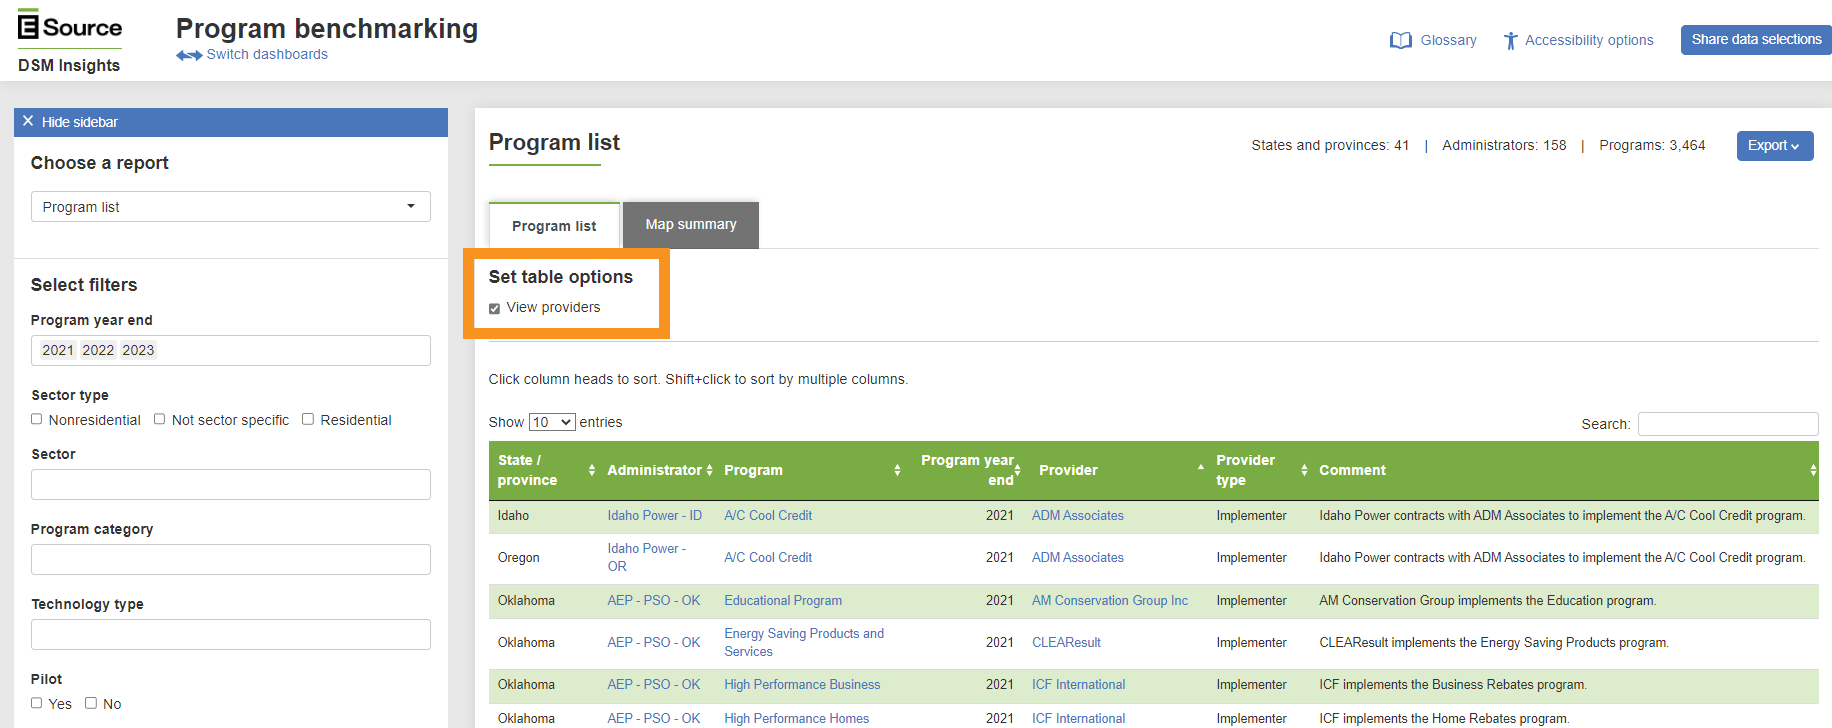
In the example above, you can see that ADM Associates was the implementer for Idaho Power’s A/C Cool Credit program in 2021.
Align with utilities’ planning cycles to provide the best solutions
Combining all the information from the examples above can help you get a complete picture of the DSM landscape, promising opportunities, and where your company can fit in. With this information, you can time your engagement with utilities to align with their planning cycles and present tailored, well-researched solutions.
You can get creative with just how you’ll use these tools. Solution providers can use DSMdat, DSM Evaluation Library, and DSM Insights to paint a clear picture of how their solutions will help utilities meet program goals and achieve an ROI.
Your offerings could help give a lift to DSM programs. If you’re interested in all the ways you can take advantage of E Source’s tools and capabilities to align with utilities’ planning cycles better, don’t hesitate to schedule a meeting with us today.